Impact Ratios in a Local Law 144 Bias Audit
Impact ratios are the core number in an LL144 audit. Here's how to read them — and their limits.
By Rovaryn Digital · · 7 min read
The report is sitting in your inbox and you don't know what the numbers mean
Your AEDT vendor just sent this year's bias audit report. The public summary is due on your website before the tool touches another NYC candidate, and somewhere in that PDF is a table of numbers labeled "impact ratio" broken out by race/ethnicity and sex categories. Some are close to 1.0. One is 0.62. You don't know if that's a problem, a rounding artifact of a small sample, or something you need to raise with the vendor before you post anything publicly.
This is the single most common moment of friction in running an LL144 program: the audit produces a number, and nobody explains what the number is actually doing. By the end of this article you'll be able to read an impact ratio in a published summary, know where it comes from, and know what it can't tell you on its own.
What an impact ratio actually measures
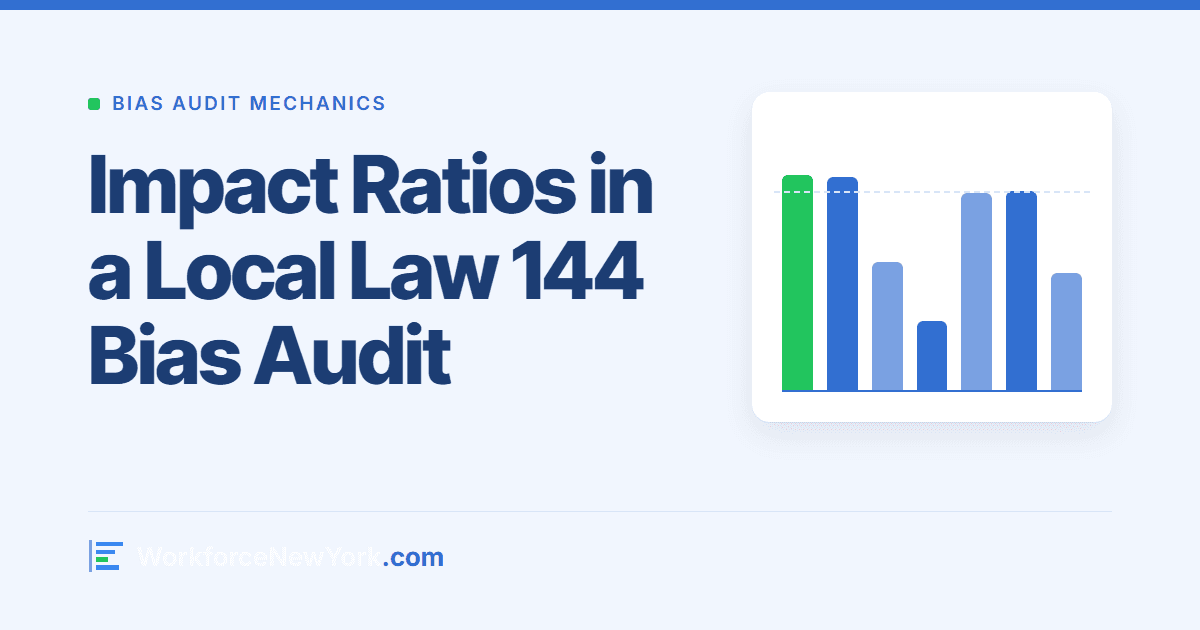
An impact ratio is a comparison, not a raw score. It compares how one demographic group fared under the AEDT against how the best-performing group fared, expressed as a single ratio. It doesn't measure whether the tool is "biased" in some absolute sense — it measures relative outcome across groups for one specific use of the tool, in one specific audit period.
The four-fifths rule — a longstanding EEOC Uniform Guidelines threshold, not something LL144 invented — treats a selection rate for any group under 80% of the rate for the highest-selected group as a potential indicator of adverse impact (via Assessment Systems, 2024). LL144's audit requirement borrows this same threshold logic and asks vendors and employers to calculate and disclose the ratio, category by category, in the published summary. We cover the mechanics of that threshold on its own in our four-fifths rule explainer — worth reading alongside this one if the term is new to you.
Selection rate vs. scoring rate — two different inputs to the same ratio
Before you can read an impact ratio, you need to know which underlying rate produced it, because LL144 audits use two different ones depending on what the AEDT does.
A selection rate is the share of a group that moves forward — hired, advanced to interview, retained — out of everyone in that group who was considered. This is the natural rate for tools that make or heavily influence a pass/advance decision.
A scoring rate is the share of a group that receives a particular classification or score band from the AEDT itself, independent of what happens downstream. This is the natural rate for tools that output a rating, ranking position, or category (e.g., "top quartile") rather than a binary advance/reject call.
Both rates get compared the same way once you have them — divide the group's rate by the highest group's rate — but confusing which one a published summary used is a common misread. We walk through the distinction in detail, with the reasoning for which rate applies to which tool type, in selection rate vs. scoring rate.
The core calculation: from rate to impact ratio local law 144 bias audit summaries publish
The arithmetic itself is simple once you have the two rates. Here's a worked example using clean, round numbers to show the method — treat the inputs as illustrative, not as a real audit result:
Say your AEDT advanced 60% of Group A candidates and 40% of Group B candidates in the audit period. Group A has the higher rate, so it's the denominator:
40 ÷ 60 = 0.667
Expressed as a percentage, Group B's impact ratio is 66.7% of Group A's rate — below the 80% four-fifths threshold, which flags it as a potential adverse-impact indicator worth further review by the independent auditor.
That's the entire calculation. What makes reading a real published summary harder is that most LL144 reports run this same division across multiple race/ethnicity categories and both sex categories, sometimes with intersectional breakdowns, and the group with the highest rate can change from category to category and from tool to tool. We break the full calculation down step by step, including how to handle the comparison-group selection when it isn't obvious which group is "highest," in the impact-ratio calculation guide.
What the published summary does — and doesn't — tell you
A quick note on what you're legally required to be looking at in the first place: LL144's three core obligations are an annual independent bias audit, a public summary of the most recent audit posted on the employer's website (alongside the AEDT's distribution date), and advance notice to candidates or employees — at least 10 business days before use — with a way to request an alternative process or accommodation (Crowell & Moring LLP, 2023; Epstein Becker Green, 2023). The impact ratio table is the analytical heart of that public summary, but it is not the whole compliance picture, and reading it correctly doesn't substitute for the other two obligations.
It's also worth knowing that the published summary you're reading might not be as reliable as it looks. A 2024 academic study reviewing 391 employers' LL144 postings — the "Null Compliance" study — found only 18 had actually posted an audit report and only 13 had posted a transparency notice at all (ACM FAccT, Wright & Muenster et al., 2024). If a vendor or peer employer's summary is thin on category breakdowns or missing sample sizes, that's consistent with a broader pattern the research has already documented, not just your case.
A separate 2025 study, "Auditing the Audits," found that many published LL144 audits may under-report disparities because of missing demographic data, opaque aggregation across categories, and metrics that don't reflect how the tool is actually deployed in practice (ACM FAccT, 2025). Translation: an impact ratio that looks clean can still be sitting on top of a category that was too small to calculate reliably, or an aggregation choice that smoothed over a real gap. Reading the ratio number is step one. Reading how it was calculated is step two, and it's the step most people skip.
Where impact ratios stop being useful on their own
An impact ratio tells you about relative outcomes for one AEDT use, in one audit period, at one employer or one vendor's aggregate dataset — whichever the summary discloses. It does not tell you:
- Whether the gap is caused by the tool, by the applicant pool, or by something upstream of the tool entirely.
- Whether a ratio below 80% in a small category is statistically meaningful or an artifact of a thin sample.
- Whether your own deployment — your job requisitions, your candidate pool, your configuration of the tool — matches the population the audit measured.
That last point matters most for anyone using a vendor-supplied audit rather than an audit run on their own data. A ratio calculated on the vendor's aggregate customer base is not automatically a ratio that describes your applicant pool.
None of this is a legal read on whether a given ratio creates disparate-impact exposure — that determination sits with your independent auditor and, where warranted, outside counsel. This section, and this article, are operations guidance for reading the number that shows up in the report, not a substitute for that judgment. If a ratio looks concerning, the next call is to your auditor, not a guess.
First action item
Reading one impact ratio correctly is useful. Reading every category in a full summary correctly, every audit cycle, without re-deriving the math from scratch each time, is what actually keeps your public posting defensible. Our Four-Fifths Rule & Impact-Ratio Reading Guide is a downloadable PDF and companion calculator built for exactly that: it walks the selection-rate-to-ratio math category by category and gives you a worksheet to log which rate type your vendor used, so you're not re-deriving the formula under deadline pressure every time a new audit report lands.
If you're earlier in the process — still mapping out which of your tools even count as an AEDT, or what your posting and notice obligations look like end to end — start with our NYC Local Law 144 compliance guide and come back to this one when the audit report is actually in hand. And for a plain read of how to work through an entire published summary, not just the ratio table, see how to read a bias audit summary.
Related guides
- Bias Audit Mechanics
How Selection Rates and Impact Ratios Are Calculated
You don't compute the audit, but you should follow its math. Here's how selection rates become impact ratios.
Rovaryn Digital · · 7 min read
- Bias Audit Mechanics
Intersectional Categories in a Bias Audit: Sex by Race/Ethnicity
LL144 audits break out intersectional groups. Here's what those cross-tabs show and how to read them.
Rovaryn Digital · · 6 min read
- Bias Audit Mechanics
Selection Rate vs. Scoring Rate in a Bias Audit
Screeners use selection rates; scorers use scoring rates. Here's how to tell which your audit reports and why it matters.
Rovaryn Digital · · 7 min read